SEGMENTS
Carmel Valley Road, like other roads, is divided into segments, usually just a few miles long, for measurement purposes.
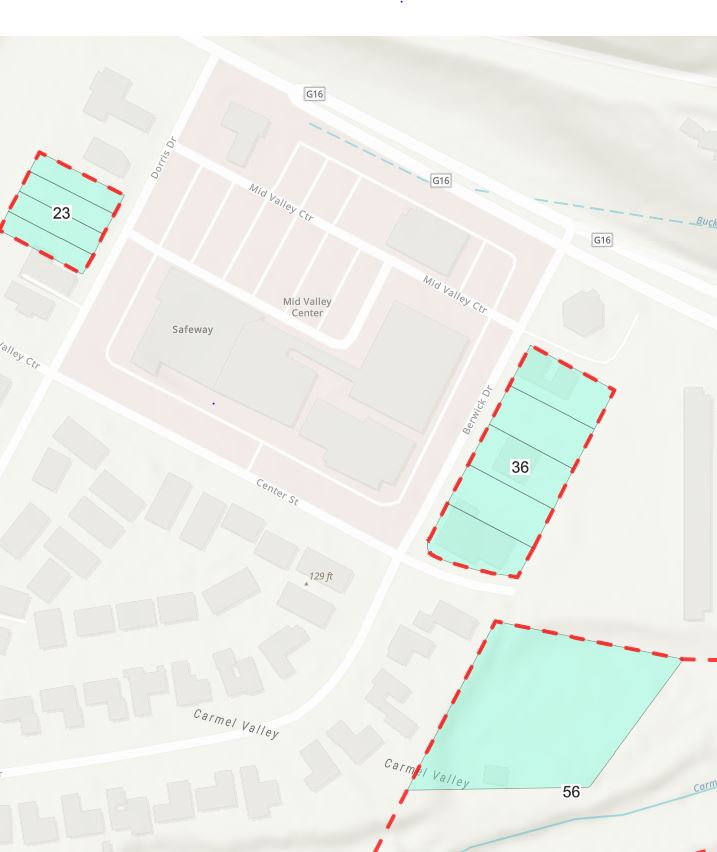
Link to a Map of Our Road's Segments
TRAFFIC DATA MEASUREMENT
Direct measurement of traffic volume consists of counting of vehicles traveling past a specified point on a road segment during a fixed period of time. The actual counts typically are recorded every fifteen minutes for several days (e.g., a week), on an automatic device. Each day’s record is made available in a readable format for analysis. Thus the fundamental measurement unit is vehicles per quarter-hour, but this is converted to vehicles per hour or vehicles per day for purposes of analysis and assessment.
CARMEL VALLEY ROAD CHARACTERISTICS
Carmel Valley Road has both two-lane and four-lane segments, but because the four-lane traffic capacities considerably exceed the existing traffic volumes, attention is focused on the two-lane segments. in the Carmel Valley Master Plan area there are seven two-lane segments of Carmel Valley Road (identified as segments 1-7), all lying between the eastern edge of Carmel Valley Village and Via Petra (just west of Rancho San Carlos Road).
In addition the segment of Highway 1 between Carmel Valley Road is critical to understanding Carmel Valley Road traffic because (1) the west-bound lanes of Carmel Valley Road are contiguous with the northbound Highway 1 lanes, there being no exit or entrance to those lanes at their intersection, and (2) southbound Highway 1 consists of a single lane that is highly congested during peak traffic times, and 2/3 of its traffic enters Carmel Valley Road so that most traffic entering Carmel Valley Road must pass through that excessively congested lane, on which traffic volume exceeds the lane’s capacity.
ANALYSIS
Two separate criteria are used to evaluate traffic service quality on two-lane roadways like most of Carmel Valley Road. Both criteria depend on traffic counts as raw data.
ADT (or AADT)
“Average daily trips” is simply the total volume of vehicle flow in 24 hours -- the number of vehicles per day. Each two-lane segment of Carmel Valley Road is assigned a “threshold”, or acceptable level of traffic volume, by the County.
PTSF
“Percent time spend following” (defined as the proportion of time during which the separation between vehicles is less than three seconds, when measured at a point along the road and at a time of peak traffic) is not really measureable in practice. In place of actual observation of the relevant percentage of time, a mathematical model (known as an exponential probability distribution) is used as a surrogate. During an hour when traffic is at its peak, the numbers of vehicles passing in each direction are observed, and the numbers are converted, through a complicated formula, into a number between zero and 100 that is presumed to represent the probability (in %) that an arbitrary vehicle would pass a fixed location less than 3 seconds after the vehicle preceding it. Thus the traffic measurement is of vehicles passing per hour, but the numerical assessment is a percentage; the formula represents the growth of traffic intensity as decreasing when the actual volume of traffic increases.
Assessment of the critical segment of Highway 1 between Ocean Avenue and Carmel Valley Road normally has been achieved through application of PTSF (described above) to the congested single southbound lane. However, a method called “multimode level of service”, or MMLOS, has recently, and totally inappropriately, used by the County to evaluate Highway 1 traffic for projects in the Carmel Valley Master Plan Area. This method does not even consider traffic volume measurements to evaluate traffic levels; instead it uses two roadway characteristics, the number of enforced stops per mile and the proportion of left-turn pockets as traffic criteria. Thus the County’s assessments are completely independent of the numbers of vehicles using the road! Furthermore, Highway 1 does not meet the basic requirements for applying the method! Use of MMLOS on Highway 1 is entirely fraudulent. Nevertheless, the County has used this inapplicable scheme in project EIRs (the current Rancho Canada Village [project approved but in litigation initiated by CVA] and Val Verde Rd. projects), despite CVA’s explicit and adamant objections.
Time periods for analysis: ADT – 24 hours; PTSF and MMLOS – 1 hour during peak traffic.
THRESHOLDS AND LOS
County traffic impact criteria are applied in two ways simultaneously on two-lane Carmel Valley Road. The term “threshold” can be used in both.
ADT
For the older ADT method, “threshold” refers to a specific volume (count) of vehicle trips per day, different for each road segment, published first for the Carmel Valley Master Plan (CVMP) in about 1991.
PTSF
For PTSF, which appears for the first time in the 2010 CVMP, the numbers of vehicle trips per hour at peak traffic times are, as indicated above, converted to percentages (PTSF values), and then the resulting percentage is assigned a letter grade (A-F, as in school grades) called “level of service” or LOS, with the boundary between D and E (i.e., at PTSF = 85%) being the “threshold” of environmental significance. In Carmel Valley, both ADT and PTSF thresholds must be respected (with ADT below the CVMP specification, and PTSF below LOS E), with failure to fall below threshold resulting in a public hearing before the Board of Supervisors.
LOS grades also are used in MMLOS assessments, but this is actually irrelevant; as indicated above, the use of MMLOS on Highway 1 is fraudulent. (This is readily demonstrable, and is discussed and explained in considerable detail in CVA comments to the County on the Rancho Canada and Via Verde EIRs.) The County has given, to the segment of Highway 1 most relevant to Carmel Valley concerns, an outrageous and indefensible LOS grade of “LOS C”, based on its MMLOS “analysis”. Among other things, the MMLOS “analysis” depends only on a pair of the roadway’s design characteristics, and not at all on the volume of traffic! All other assessments of that segment for many years have been LOS F, i.e., traffic exceeds the capacity of the road segment. The pre-MMLOS evaluations have been based on PTSF analyses of the single southbound lane.
LOS F means traffic exceeds road capacity; not even one vehicle trip is to be added during peak hour.
Analysis of 2014 Monitoring and Report of Traffic on Carmel Valley Road
by CVA Traffic Chair
Dr. Tim Sanders:
The January 29, 2015 CVA Bulletin carried a statement that CVA had presented to the County Board of Supervisors in response to the 2014 annual County report on Carmel Valley Road (CVR). Some additional details might be useful to 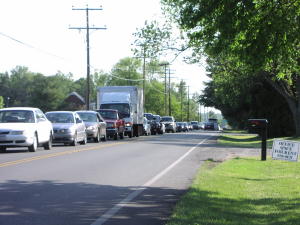 Carmel Valley residents. Four of the five two-lane segments of CVR between Esquiline Road and Rancho San Carlos Road are near the traffic volume limits set for them in the Carmel Valley Master Plan (CVMP); for easy reference, the five are numbered
3. Esquiline to Ford
4. Ford to Laureles Grade
5. Laureles Grade to Robinson Canyon
6. Robinson Canyon to Schulte
7. Schulte to Rancho San Carlos.
Segments 3, 4, 6 and 7 were the principal subject of the CVA statement.
These are the heart of Carmel Valley Road, and play a major role in the Master Plan and its history.
Roughly 35 years ago a number of foresighted and determined Valley residents (members of the original CVA), in order to protect the Valley’s rural character, composed a master plan covering the area from the eastern edge of the Village to Highway 1, ridge to ridge. With the aim of preventing suburban- and urban-style traffic congestion, the master plan created a process for establishing traffic standards on CVR. By 1991 a firm set of standards was in place, and the CVMP requirement that CVR traffic levels be monitored and reported annually was fully implemented. Last week’s Bulletin responded to the most recent of these County monitoring reports.
What we often want to know from the reports is, “How much more traffic can CVR tolerate until Environmental Impact Reports must show significant environmental impacts?” For a variety of reasons there is no simple and fixed answer, but we can make reasonable rough estimates based on existing policies and data. Our initial challenge is to insure that existing policies are interpreted fairly and are fully enforced, and that real data is respected. Toward that end we examine relevant parts of the 2014 report.
In the table that follows, the first three columns are the same as those in the previous CVA Weekly Bulletin, and the fourth column shows the number of vehicle trips per day that, if added, would cause the segment’s traffic to exceed its threshold of acceptability or of significant environmental impact. The final two columns show the relevant thresholds themselves as published in the Carmel Valley Master Plan, and the measurements of 2014 daily traffic volumes. The first four rows represent data collected in June of 2014 on relevant CVR segments (3,4,6,7), and the final four rows are for October on the same segments; the only segments considered relevant are those that have a reasonable likelihood of undergoing significant environmental impacts from potential new development.
| Segment |
Date Measured |
% of Threshold |
Trips/Day
Below Threshold |
Threshold (trips/day) |
2014 Volume (trips/day) |
| 3 |
20-Jun |
98.9 |
101 |
9,065 |
8,964 |
| 4 |
20-Jun |
98.6 |
168 |
11,600 |
11,432 |
| 6 |
20-Jun |
94.6 |
831 |
15,490 |
14,659 |
| 7 |
20-Jun |
98.6 |
233 |
16,340 |
16,107 |
| 3 |
29-Oct |
93.0 |
633 |
9,065 |
8,432 |
| 4 |
30-Oct |
98.1 |
216 |
11,600 |
11,384 |
| 6 |
30-Oct |
94.7 |
818 |
15,490 |
14,672 |
| 7 |
30-Oct |
98.7 |
210 |
16,340 |
16,130 |
The boldface underlined numbers in the table are the smaller values of “trips below threshold” for each segment; these are the additional traffic volumes allowed before the impacts are considered environmentally significant. Thus segment 3 would tolerate 101 new trips per day, segment 4 would tolerate 168, 5 would tolerate 818, and 7 would tolerate 210.
Typically a residential unit adds about 10 trips per day, so dividing by 10 gives the approximate number of residential units contributing directly to each segment; therefore the tolerable number of new residential units contributing traffic would be about 10 for segment 3, about 17 for segment 4, about 82 for segment 6 and about 21 for segment 7.
Since any new units generating traffic on Carmel Valley Road would contribute their traffic to several segments, the smaller tolerances are the more relevant ones; a good guess probably is that roughly 20 new residential units, or the equivalent, would formally yield a permanent adverse environmental impact on the two-lane portion of Carmel Valley Road.
Another, more complex, type of measurement called “percent time spent following” (PTSF) also is monitored and reported. It shows that segments 6 and 7 already have significant adverse environmental impacts from traffic imposed earlier. The threshold of significance for these segments is a PTSF of 85.0 on a sale of 100, and segments 6 and 7 have PTSF values of 86.0 and 89.3 respectively. By this measure, there is no available tolerance for additional traffic volume on segments 6 and 7 according to the CVMP.
Carmel Valley residents must now decide how they will respond to these circumstances in order to sustain the rural character of Carmel Valley Road and of the Valley itself, and they must now make their determination known to County decision makers. The CVMP is not self-enforcing!

 Carmel Valley residents. Four of the five two-lane segments of CVR between Esquiline Road and Rancho San Carlos Road are near the traffic volume limits set for them in the Carmel Valley Master Plan (CVMP); for easy reference, the five are numbered